-
Services
Artificial Intelligence
 AI ConsultingStrategic AI Roadmaps
AI IntegrationSeamless System Intelligence
AI Agent DevelopmentAutonomous Task Automation
AI Chatbot DevelopmentSmart Conversational Interfaces
Generative AIAI-Powered Content Creation
ML DevelopmentPredictive Model Engineering
Deep LearningAdvanced Neural Architectures
Natural Language ProcessingHuman-Like Language UnderstandingCloud & DevOps
Cloud Strategy & ConsultingScalable Cloud Roadmaps
DevOps Consulting ServicesAccelerated Delivery Strategy
Cloud MigrationSecure Infrastructure Transition
DevOps CI/CD ServicesContinuous Delivery Optimization
Cloud IntegrationUnified Cloud Ecosystems
DevSecOps ServicesSecure DevOps Automation
Cloud Infrastructure Management ServicesReliable System Operations
DevOps Automation ServicesIntelligent Workflow AutomationInternet of Things
IoT solution consultingConnected Ecosystem Strategy
IoT App DevelopmentSmart Connected Applications
IoT IntegrationSmart Connected Applications
IoT Data AnalyticsReal-Time Data Intelligence
Industrial IoT SolutionsIntelligent Industrial Automation
Wearable App DevelopmentSmart Wearable ExperiencesDevelopment Services
Mobile App DevelopmentScalable Mobile Experiences
Web App DevelopmentHigh-Performance Web Applications
Website DevelopmentConversion-Focused Web Platforms
SaaS DevelopmentCloud-Based Software Solutions
Product DevelopmentEnd-to-End Digital Products
MVP DevelopmentRapid Market-Ready Prototypes
Blockchain App DevelopmentSecure Decentralized Solutions
AI ConsultingStrategic AI Roadmaps
AI IntegrationSeamless System Intelligence
AI Agent DevelopmentAutonomous Task Automation
AI Chatbot DevelopmentSmart Conversational Interfaces
Generative AIAI-Powered Content Creation
ML DevelopmentPredictive Model Engineering
Deep LearningAdvanced Neural Architectures
Natural Language ProcessingHuman-Like Language UnderstandingCloud & DevOps
Cloud Strategy & ConsultingScalable Cloud Roadmaps
DevOps Consulting ServicesAccelerated Delivery Strategy
Cloud MigrationSecure Infrastructure Transition
DevOps CI/CD ServicesContinuous Delivery Optimization
Cloud IntegrationUnified Cloud Ecosystems
DevSecOps ServicesSecure DevOps Automation
Cloud Infrastructure Management ServicesReliable System Operations
DevOps Automation ServicesIntelligent Workflow AutomationInternet of Things
IoT solution consultingConnected Ecosystem Strategy
IoT App DevelopmentSmart Connected Applications
IoT IntegrationSmart Connected Applications
IoT Data AnalyticsReal-Time Data Intelligence
Industrial IoT SolutionsIntelligent Industrial Automation
Wearable App DevelopmentSmart Wearable ExperiencesDevelopment Services
Mobile App DevelopmentScalable Mobile Experiences
Web App DevelopmentHigh-Performance Web Applications
Website DevelopmentConversion-Focused Web Platforms
SaaS DevelopmentCloud-Based Software Solutions
Product DevelopmentEnd-to-End Digital Products
MVP DevelopmentRapid Market-Ready Prototypes
Blockchain App DevelopmentSecure Decentralized Solutions - Hire Expert
-
Industries
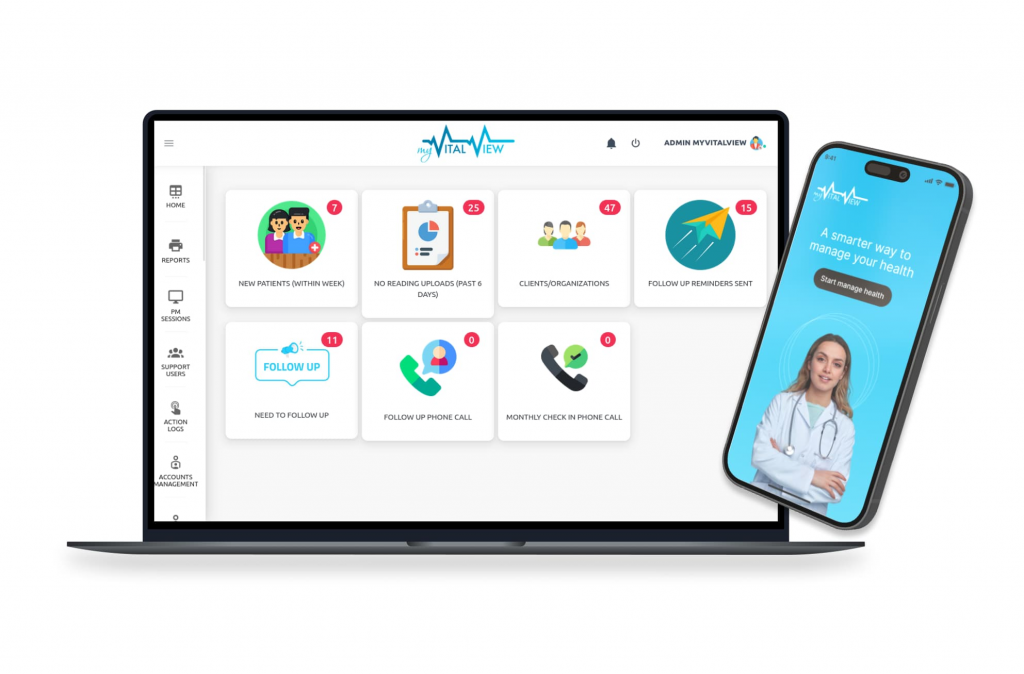
HealthcareEnable intelligent care systems
Financial & InsuranceBuild secure fintech platforms
EducationModernize learning experiences
Real EstateTransform property management
Retail & eCommerceBoost online shopping efficiency
ManufacturingAutomate production processes
TravelEnhance traveler experiences
Food & BeverageDigitize ordering & delivery
HospitalityEnhance guest digital journeys
AdvertisingCreate engaging brand campaigns
Computer & ElectronicsInnovate smart digital products
Management & ConsultingOptimize operations & workflows
Media & EntertainmentDeliver immersive digital content
-
About Us
Still relying on manual work while competitors grow with AI? We’ll fix your workflow.Schedule a Free Call