Contact Us Contact Us Arrow Contact Us Background

Data
Visualization Services

Turn Raw Data into Growth Engines with Data Visualization Consulting Services

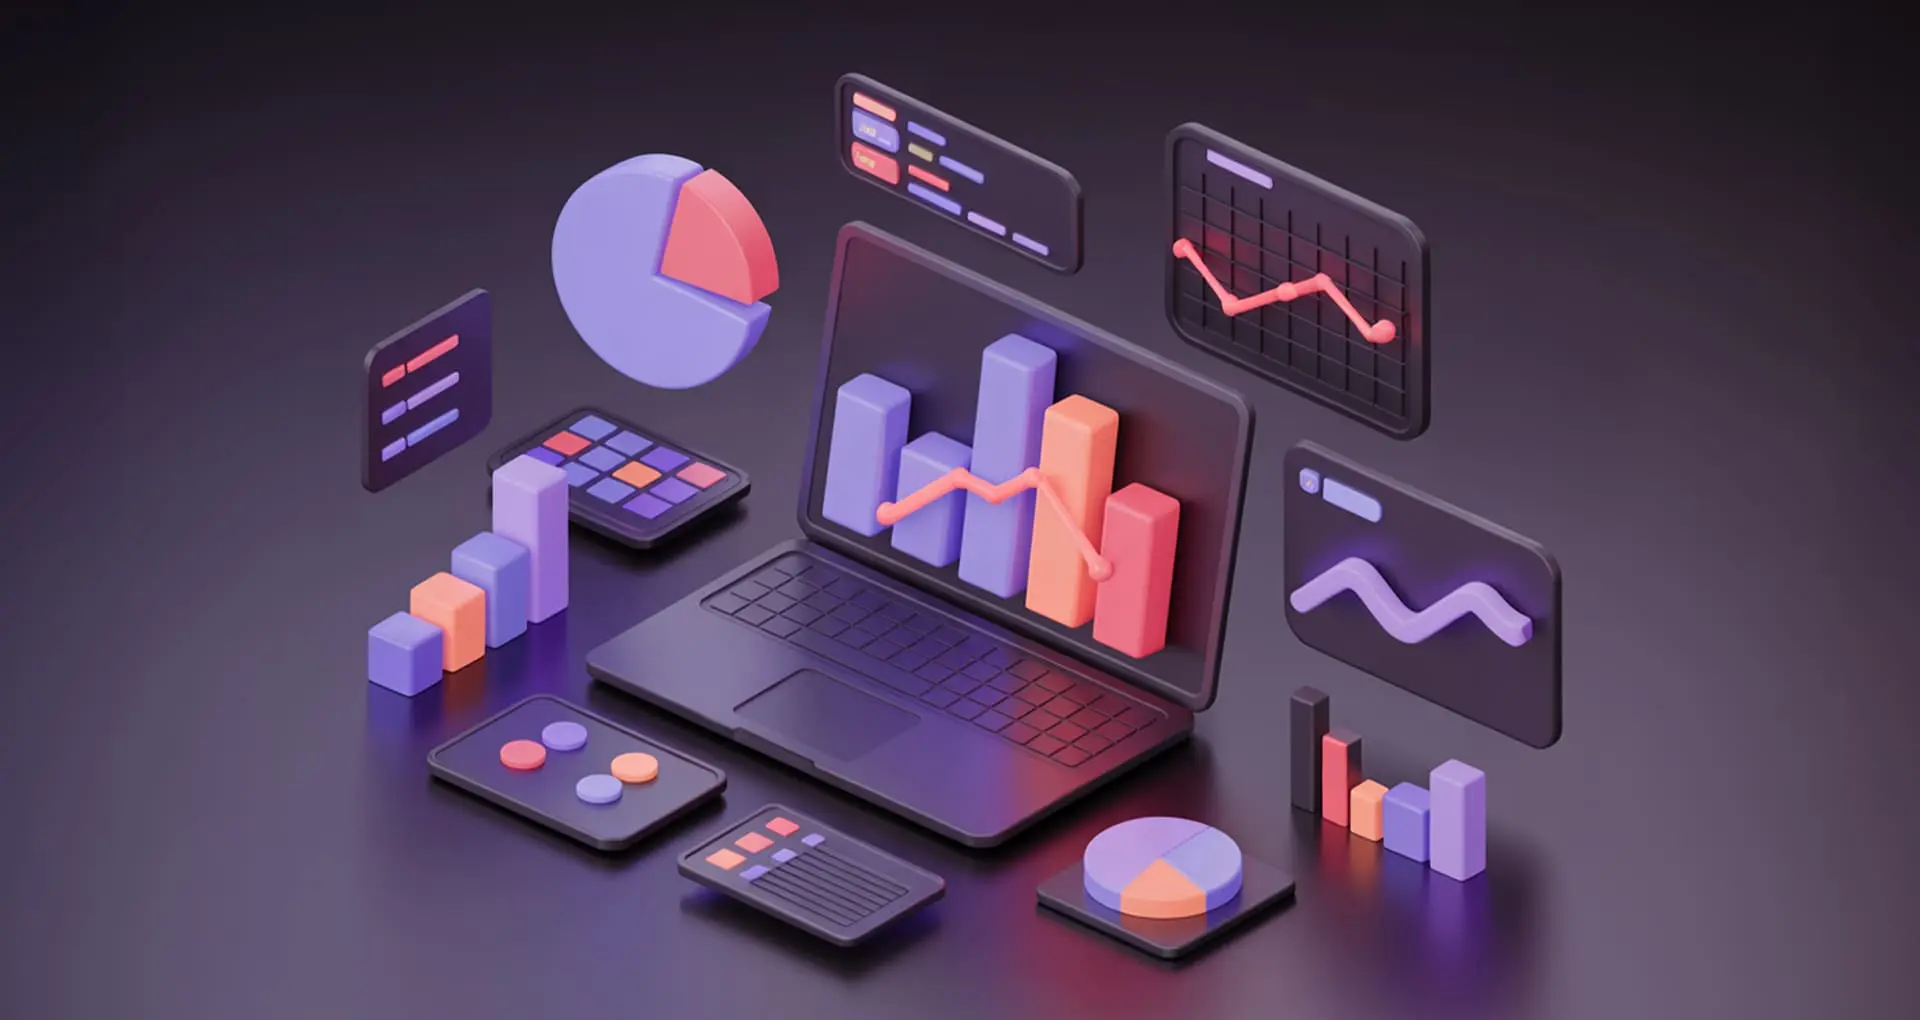
Turbocharge your decision-making with Technource’s advanced data visualization solutions. We develop insightful visuals and interactive dashboards, allowing you to make data-driven decisions efficiently and accurately.

In Collaboration with Global Leaders

Data Visualization Consulting Services to Meet Your Business Goals

Being one of the reputed data visualization service providers, we provide customized solutions that turns your complex data into actionable insights.

Data Visualization Service

BI Platform Development

arrow_icon

Our robust team develop custom business intelligence platforms that consolidates data flowing from diverse sources. We develop interactive dashboards, provide actionable insights to make informed decisions across various department.

Data Visualization

arrow_icon

We research on data engagement to drive transparency with the cloud-powered dashboards that promotes cross-functional collaboration.

Data Integration

arrow_icon

Unveil richer insights by integrating disparate data into a unified, analysis ready format with our data visualization consulting services.

Data Visualization Optimization

arrow_icon

Turn massive datasets into interactive, dynamic visuals with our optimization expertise. Our data visualization solutions reduce information overload, while improving data accessibility.

Data Platform Development

arrow_icon

We develop scalable platforms to gather, store, process and analyze large chunk data by utilizing database management systems like MySQL, MongoDB and Oracle. Our robust development teams embed multiple technologies for real-time analytics and data streaming.

BI tools Implementation

arrow_icon

Foster your Team productivity with modern BI tools to transform raw data into thought-provoking visual stories. We provide flexible visualization options, that fosters productivity.

Turn complex data into clear, interactive visuals that drive faster business decisions

Why do You Need Data Visualization Services?

Forecast demand, detect patterns and unveil opportunities with our data visualization services.

service_feature_icon

Unlock Key Values

With data visualization, you can make the key values clear and easily visible. This make the things easier for the team members to understand and interpret data accordingly.

service_feature_icon

Increased User Engagement

Data visualization services include next level presentation by using the appropriate chart and formatting options to increase user engagement.

service_feature_icon

Easy to Understand

Data visualization services aim to translate data into a quick form, understandable for everyone. With data visualization, you can eliminate noise so that useful information is highlighted.

service_feature_icon

Next Level Data Exploration

Data visualization enables for interactive hierarchies and exploration for facilitating next level data exploration.

service_feature_icon

3X Innovation & Growth

Unveil the trends and patterns that manual methods may miss. With cutting-edge data visualization services, gain foresight into current market trends.

service_feature_icon

Connected Teams

Data visualization integrates with existing system and breaks down silos and creates a collaborative ecosystem.

Why Choose Technource for Data Visualization Services?

80%

Increased Usability

38%

Forecast Accuracy

3+

International Offices

82%

Reduction in Data Visualization Issues

95%

Client Satisfaction Ratesupport

30+

Data Visualization Developers

Data Visualization Process- Steps We Follow

Unleash the power of enterprise data with our well-thought data visualization procedure to deliver secure, scalable and robust solutions.

saas_dev_process_img
1

Objective Identification

Initially, our data visualization consulting agent discusses with the project needs to define the goals, which ensures that they align with your business objectives.

2

Relevant Data Collection

We gather relevant and accurate data from multiple sources to ensure the visualizations are based on up-to-date information.

3

Data Examination

We analyze the data thoroughly to assess the key trends, insights and patterns which help your business to make informed decisions.

4

Right Visualization Method Selection

We choose the ideal data visualization method to showcase your data clearly through interactive dashboards or graphs.

5

Data Refining and Structuring

From organizing to refining data, we ensure that your data reflects accuracy, clarity and easy interpretation for efficient decision making.

6

Visual Story Creation

Next, we design interactive, compelling data visualization solutions to tell you a clear story for your brand. This helps the team understand your data in order to make impactful decisions.

service_cta_chat_icon Schedule a Visualization Consultation

What Benefits Will You Get with Data Visualization Services?

90%
Better Data Storytelling
92%
Increased Report Automation
70%
Better AI-powered Data Visualization
68%
Better Advanced Analytics Visualization.

Tech Stack for Data Visualization

Power BI Power BI
Tableau Tableau
Looker Looker
Apache Superset Apache Superset
D3.js D3.js
Chart.js Chart.js
Highcharts Highcharts
APIs APIs
SQL Databases SQL Databases
NoSQL Databases NoSQL Databases
Cloud Data Sources Cloud Data Sources
Apache Spark Apache Spark
dbt dbt
Snowflake Snowflake
BigQuery BigQuery
Amazon Redshift Amazon Redshift
AWS AWS
Azure Azure
Google Cloud Google Cloud

Data Visualization Projects by Technource

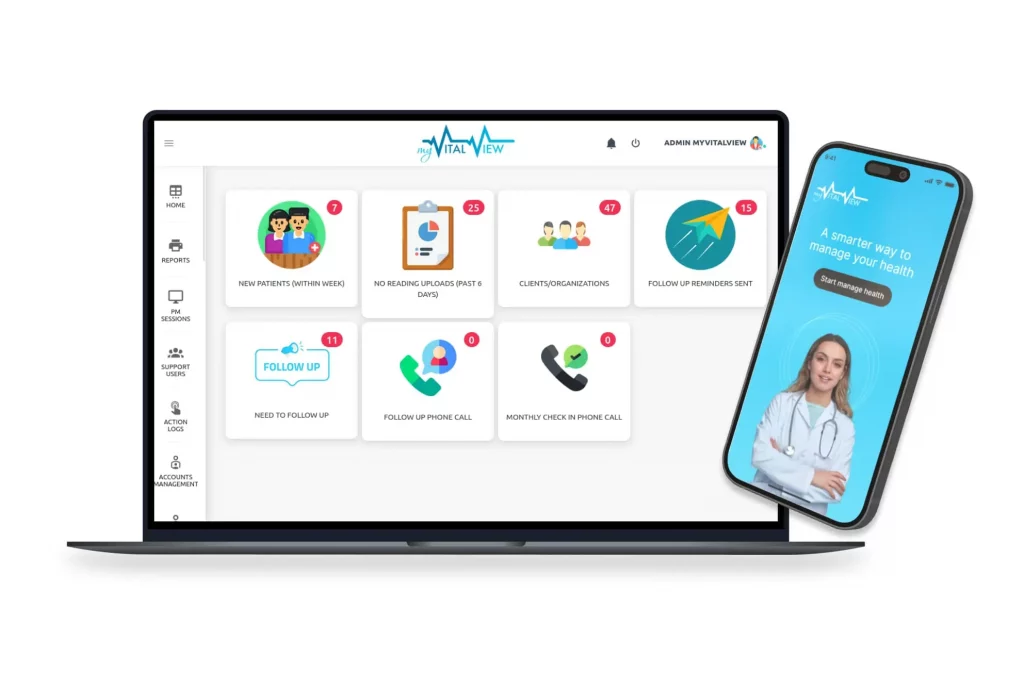
My Vital View
My Vital View
Remote Healthcare Platform

A healthcare company in the U.S. focused on remote care. MVV helped them monitor patients at home, automate RPM/CCM processes, and boost provider efficiency.

50%
Faster Clinical Decision Making
100%
Remote Access Capability
Technource ERP
Technource ERP
Internal Operations Management System

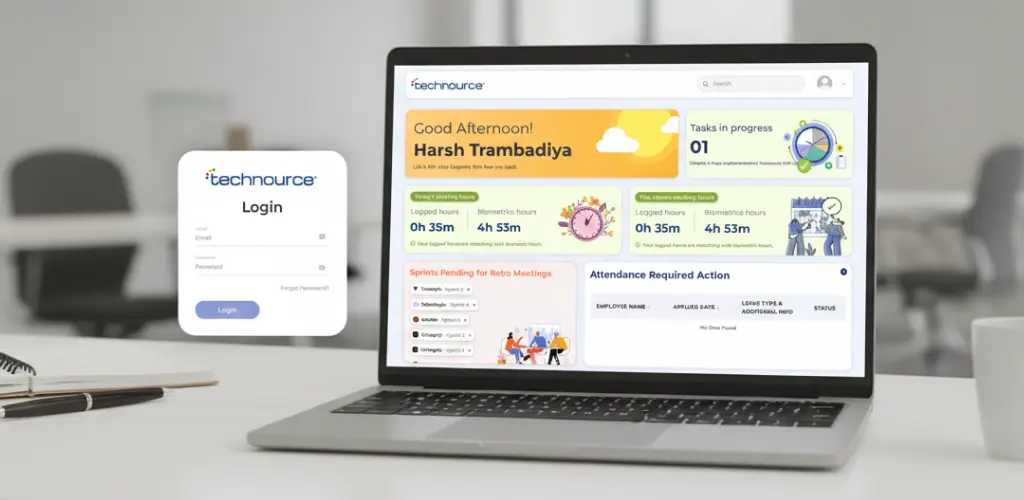
An in-house ERP platform for Technource that centralizes HR, attendance, and project tracking. It automates workflows, enhances accuracy, and offers real-time dashboards—reducing manual work and improving project delivery efficiency.

60%
Fewer Attendance Related Errors
90%
Real-time Visibility into KPIs
Atomo Games
Atomo Games
iGaming Wallet & API Hub

A scalable iGaming engine that unifies game integration, real-time wallet handling, payments, jackpots, and bonuses under secure APIs. Atomo Games helps casino partners onboard faster, improve uptime, and deliver seamless...

75%
Faster Wallet and Transaction Processing
100%
Secure and Verified API Communication
service_cta_chat_icon Start Your Visualization Project

Client Success Stories

testimonial_quote_icon

Technource is excellent, Got all the work done we requested we are on our way to making www.cluboutdoors.com.au look GREAT.Well Done and thanks for the excellent work.I hired them for Shopify eCommerce work many time they can do anything in shopify design and development.


Andy Michelis
testimonial_quote_icon

The team over at Technource are the definition of professional. They are fantastic to work with and I can't wait to bring them on to my next project. I had a pretty sophisticated idea for a website, and not only were they able to actually understand it and break it down into milestones, they were ab...

Aditya Bavde
testimonial_quote_icon

Working with Technource has been a pleasure. They bring expertise, reliability, and innovation to every project. Our collaboration has led to several successful outcomes in competitive markets, and we value them as a long-term partner."

Ivan Šimić
CEO, Hertronic
×

Frequently Asked Questions

We work with Power BI, Tableau, Looker, Apache Superset, and custom visualization frameworks based on project needs.

Yes, we integrate data from databases, cloud platforms, APIs, CRMs, ERPs, and third-party tools into unified dashboards.

Yes, we build role-based and industry-specific dashboards tailored for executives, managers, analysts, and operational teams.

Most projects take 2–6 weeks, depending on data complexity, integrations, and customization requirements.

Yes, we enhance performance, improve UX, optimize queries, and upgrade legacy dashboards to modern BI platforms.

Yes, we offer continuous support, enhancements, monitoring, and user training post-deployment.

testimonial_quote_icon
Transform complex datasets into clear, interactive dashboards that drive faster decisions
Insights everyone can understand
curve_icon Consult Data Visualization Experts
amar_purohit_cta_image
Amar Purohit
Head of Business Development