
Short Summary
This guide explains how AI predictive maintenance for solar and battery storage works, where it pays off, and what it costs to build. You will see the data it needs, a step-by-step build plan, cost tiers, ROI math, and two Technource case studies with measured results.
Key Takeaways
- AI predictive maintenance for solar and battery storage costs $10,000–$50,000 for an AI MVP covering one fleet. A single-site proof of concept costs $5,000–$10,000, and a multi-site enterprise platform costs $60,000–$100,000.
- A proof of concept takes 4–6 weeks. An AI MVP with alerts and work orders takes 10–16 weeks, and an enterprise rollout takes 4–6 months.
- Start with the SCADA, inverter, and battery management system data you already collect. Add new sensors only where a data audit shows a blind spot.
- US solar sites can lose up to about $5,000 per MW of revenue each year to equipment underperformance (Raptor Maps, 2026).
- Technource monitoring builds delivered 65% faster environmental adjustments (Digital Biologix) and 65% faster waste collection (Clean Medic).
Solar and battery storage now lead new power capacity in the US.
Developers plan to add about 43 GW of utility-scale solar and 24 GW of battery storage in 2026, nearly 80% of all planned US additions (EIA, 2026).
Maintenance budgets are shifting with that growth. The global predictive maintenance market was worth about $14 billion in 2025 and is growing nearly 28% a year (Grand View Research).
Yet most O&M teams still find faults late: after an inverter trips, a string goes dark, or a battery rack hits a temperature alarm.
AI predictive maintenance for solar and battery storage flags those faults while they are still trends, so crews fix them before output drops.
The hard part is rarely the model. It is clean data, alerts that technicians trust, and work orders that close the loop.
What Is AI Predictive Maintenance for Solar and Battery Storage?
AI predictive maintenance for solar and battery storage is software that applies machine learning to SCADA, inverter, tracker, and battery data to predict equipment faults before they cause downtime. The system ranks each risk and turns it into a work order for the O&M team.
Predictive maintenance sits between two older approaches.
Reactive maintenance fixes equipment after it fails. Preventive maintenance services equipment on a fixed calendar, whether it needs attention or not.
Predictive maintenance acts when the data shows a component’s condition slipping.
Building one combines IoT data pipelines, machine learning models, and workflow automation, which is the core of our AI development services.
| Layer | What It Does | Example |
|---|---|---|
| Data ingestion | Pulls SCADA, inverter, BMS, weather, and inspection data into one store | 5-minute inverter power and temperature readings |
| Anomaly detection | Learns each asset’s normal behavior and flags drift | A string under-producing against its neighbors |
| Failure prediction | Estimates time to failure or remaining useful life | An inverter cooling fan trending toward overheating |
| Prioritization | Ranks alerts by revenue at risk and safety | A battery rack temperature alert ahead of a soiling alert |
| Work orders | Creates and routes tickets in the CMMS | Ticket with fault code, location, and suggested parts |
Why Are Solar and Storage Operators Investing in AI Predictive Maintenance?
Solar and storage operators invest in AI predictive maintenance because equipment-driven losses keep rising while O&M crews stay thin. The average US solar site lost about 5% of its power to equipment issues in 2025, more than double the level five years earlier (Raptor Maps, 2026).
Sites using robotics and automation averaged about 3% loss in the same dataset. That gap shows what faster detection is worth.
| Benefit | What Changes | Evidence |
|---|---|---|
| Less unplanned downtime | Faults are fixed before an inverter trips or a rack derates | Lower power loss on automated sites (Raptor Maps data above) |
| Fewer truck rolls | Crews arrive with a diagnosis, the right parts, and a priority | Remote triage replaces ‘go and look’ visits |
| Longer battery life | Cycling and thermal stress are tuned before degradation speeds up | State-of-health trends per rack and module |
| Stronger warranty claims | Fault history is logged with timestamps and data | Evidence packs for OEM and insurer claims |
| Better use of thin crews | Technicians work a ranked list instead of an alarm feed | Each technician now covers 70% more MW than five years ago (Raptor Maps, 2026) |
Benefits for Asset Owners and Investors
- Protected revenue: Earlier fixes mean fewer lost MWh and fewer missed capacity or availability payments.
- Predictable O&M budgets: Planned repairs replace emergency call-outs and rush-shipped parts.
- Bankable data: Lenders and insurers see a documented record of monitoring and response.
Benefits for O&M Teams and Technicians
- One ranked work list: Crews see the faults that matter most, not hundreds of raw alarms.
- Fewer wasted trips: Each visit starts with a likely cause and a parts list.
- Clear root cause: Logged data shows whether a fault came from the equipment, the weather, or the operating pattern.
Planning predictive maintenance for your solar or storage fleet but not sure where to start?

Predictive vs Preventive vs Reactive Maintenance: What’s the Difference?
Reactive maintenance repairs equipment after it fails, preventive maintenance follows a fixed calendar, and predictive maintenance acts on data showing a component’s condition slipping. Predictive maintenance usually cuts both emergency repairs and unnecessary scheduled visits.
| Criteria | Reactive | Preventive | Predictive |
|---|---|---|---|
| Trigger | Failure or alarm | Calendar or run hours | Condition trend in the data |
| Downtime | Highest; asset is down until repaired | Medium; planned outages | Lowest; fixes fit planned windows |
| Truck rolls | Urgent and often repeated | Scheduled and often unneeded | Targeted, with a diagnosis |
| Data needed | Alarms only | Asset register and schedules | Time-series SCADA, BMS and event data |
| Best for | Low-value, easy-to-replace parts | Cleaning, vegetation, and compliance checks | Inverters, trackers, transformers and battery racks |
Most fleets run all three. The goal is to move high-value assets into the predictive column.
What Are the Main Use Cases for Solar and Battery Storage?
The highest-value use cases are inverter fault prediction, string and tracker fault detection, battery state-of-health forecasting, and thermal anomaly monitoring. Each one targets a component that is expensive to lose and slow to diagnose by hand.
Solar Use Cases
| Use Case | Data Used | What AI Detects |
|---|---|---|
| Inverter fault prediction | Power, temperature, fan speed, error codes | Cooling fan wear, power stage stress, rising fault frequency |
| String and combiner monitoring | String current and voltage, irradiance | Open strings, blown fuses, mismatch against neighbors |
| Tracker failure detection | Tracker angle, motor current, wind data | Stuck rows, motor faults, failed stow commands |
| Soiling and cleaning planning | Performance ratio, weather, dust forecasts | When cleaning pays back against lost output |
| Module defects from drone imagery | Thermal and visual drone images | Hotspots, cracked cells, bypass diode failures |
| Transformer health | Oil temperature, load, gas analysis | Overheating and insulation stress |
Weather is part of maintenance too. Hail accounts for about 73% of insured solar losses by damage amount (kWh Analytics, 2026).
Models that combine storm forecasts with tracker data can trigger hail stow early and log which rows actually moved.
Battery Storage (BESS) Use Cases
| Use Case | Data Used | What AI Detects |
|---|---|---|
| Cell and module anomaly detection | Cell voltage, temperature, internal resistance | Voltage drift, temperature outliers, weak cells |
| State-of-health forecasting | Cycle count, depth of discharge, capacity tests | Faster-than-expected capacity fade |
| Thermal system monitoring | HVAC data, rack and ambient temperature | Failing HVAC units, hot racks, blocked airflow |
| Power conversion system health | PCS temperatures, fault logs, switching data | Fan, filter, and capacitor wear |
| Augmentation planning | State-of-health trends, contract capacity, dispatch history | When to add capacity to meet guarantees |
| Warranty compliance | SoC windows, temperature history, cycling | Operation outside warranty limits before it voids coverage |
BESS safety has improved fast. The global failure rate per deployed GWh fell 98% between 2018 and 2025, though older systems still fail at higher rates (EPRI, 2026).
That makes predictive monitoring most valuable on older fleets and on systems running close to their warranty limits.
Most of the signals already exist inside the battery management system, so the first job is getting that data out cleanly.
Which AI Features Are Worth Building Into a Predictive Maintenance System?
The AI features worth building first are anomaly detection, failure prediction, alert ranking by revenue at risk, and automatic work-order creation. These four turn raw data into a fix a technician can act on the same day.
| AI Feature | What It Does | Risk / Impact |
|---|---|---|
| Anomaly detection | Flags behavior that drifts from an asset’s normal pattern | High impact; needs tuning to avoid alert floods |
| Remaining useful life prediction | Estimates time to failure for inverters and battery modules | High impact; needs failure history or physics rules |
| Alert ranking | Scores alerts by revenue at risk, safety, and crew location | High impact; low model risk |
| Root-cause suggestions | Matches a fault pattern to past fixes and parts | Medium impact; needs clean work-order history |
| Automatic work orders | Creates CMMS tickets with fault data, location, and parts | High impact; needs CMMS API access |
| Computer vision on drone images | Finds hotspots and cracked modules in thermal images | High impact on large sites; needs regular flights |
| Natural-language O&M assistant | Answers questions such as why a site underperformed yesterday | Medium impact; needs guardrails on accuracy |
Alert fatigue sinks more monitoring projects than weak models do. A system that fires hundreds of alerts a day trains crews to ignore all of them.
In the My Vital View project, an extreme reading first triggered an automatic retest, and providers were alerted only if the second reading was also extreme. The same confirm-before-alert rule works for inverter and battery alarms.
Alerts should therefore feed AI-powered workflow automation that confirms, ranks, and routes each issue before anyone gets paged.
What Data and Integrations Does Predictive Maintenance Need?
AI predictive maintenance needs at least 12 months of SCADA or inverter data at 5- to 15-minute intervals, battery management system data for storage assets, weather data, and work-order history from the CMMS. Most fleets already collect this data but keep it in separate systems.
| Integration | Standard or Tool | Typical Use |
|---|---|---|
| Plant SCADA | Modbus TCP, DNP3, OPC UA | Inverter, meter and tracker readings |
| Inverters and devices | SunSpec Modbus, vendor APIs | Fault codes, temperatures, string data |
| Battery management system | Modbus, CAN via gateway, vendor APIs | Cell voltage, temperature, SoC and state of health |
| Energy management system | Vendor APIs, OPC UA | Dispatch schedules and setpoints |
| CMMS and work orders | IBM Maximo, ServiceNow, UpKeep APIs | Ticket creation and repair history |
| Weather and irradiance | Satellite irradiance and forecast APIs | Expected output and storm alerts |
| Drone inspections | Thermal imagery platforms | Module and hotspot defects |
Turning these feeds into one clean time-series store is the job of an IoT data analytics company before it is an AI job.
If you also run an energy management platform, connect its dispatch data, because heavy cycling changes how batteries age.
In the Digital Biologix project, tuning MQTT message queues and payload sizes gave near-instant sync between field controllers and the app, even on weak networks. Remote solar and storage sites face the same bandwidth limits.
Which Safety Standards and Rules Apply to BESS Monitoring?
BESS monitoring software commonly supports work under NFPA 855 for stationary energy storage installation, UL 9540 and UL 9540A for system safety and thermal runaway testing, and NERC CIP cybersecurity rules where an asset falls in scope. Predictive maintenance software does not certify a site, but its data and logs support inspections, incident reviews, and warranty claims.
This section is general information, not legal or regulatory advice. Confirm your obligations with your authority having jurisdiction, your insurer, and qualified counsel.
| Standard or Rule | Applies To | What It Means for Your Software |
|---|---|---|
| NFPA 855 | Installation of stationary energy storage systems | Keep alarm, monitoring, and commissioning records easy to retrieve |
| UL 9540 / UL 9540A | Storage system safety and thermal runaway fire testing | Store the certified operating limits and alert on drift outside them |
| NERC CIP | Cyber assets tied to the bulk electric system, where in scope | Access control, logging and secure remote access for monitoring tools |
| IEC 61724 | PV system performance monitoring | Consistent sensor and performance-ratio definitions |
| OEM warranty terms | Battery and inverter warranties | Track SoC windows, temperature and cycling against warranty limits |
| Insurer requirements | Property and performance insurance | Evidence of monitoring, maintenance and response times |
Technource’s Recommendation
Map your monitoring data to the warranty and insurance terms before you design the alerts. In storage projects, those contracts define what normal operation means, so the model should flag drift against that definition, not only against history.
Not sure which data your BESS monitoring should capture for safety reviews and warranty claims?

What Tech Stack Works Best for AI Predictive Maintenance?
A typical 2026 stack uses edge gateways with MQTT or Modbus, a time-series database such as InfluxDB or TimescaleDB, Python models built with scikit-learn, XGBoost, or PyTorch, MLflow for model tracking, and a React dashboard on AWS, Azure or Google Cloud. The stack matters less than clean data and a working link to the CMMS.
| Layer | Common Choices | Note |
|---|---|---|
| Edge and connectivity | AWS IoT Greengrass, Azure IoT Edge, MQTT | Buffers data when site links drop |
| Streaming | Apache Kafka, Amazon Kinesis | Handles high-frequency BMS data |
| Storage | InfluxDB, TimescaleDB, S3 data lake | Time-series first; raw data kept for retraining |
| Pipelines | Apache Airflow, dbt | Aligns timestamps, fills gaps, maps tags |
| Models | Python, scikit-learn, XGBoost, PyTorch | Gradient-boosted trees are a strong start for tabular data |
| MLOps | MLflow, Amazon SageMaker, Azure ML | Versioning, drift checks and retraining |
| Apps | React, Grafana, Flutter | Web dashboard plus a mobile app for field crews |
| Integrations | REST APIs, CMMS connectors | Work orders, parts and closure data |
Technource’s Recommendation
Start with gradient-boosted models and simple statistical baselines on the data you already have. Move to deep learning only for high-frequency battery signals or drone imagery, where simpler models stop improving.
How to Build an AI Predictive Maintenance System: Step-by-Step
Building an AI predictive maintenance system takes five core steps, from a data audit to a validated field pilot. An AI MVP covering one fleet typically takes 10–16 weeks end to end.
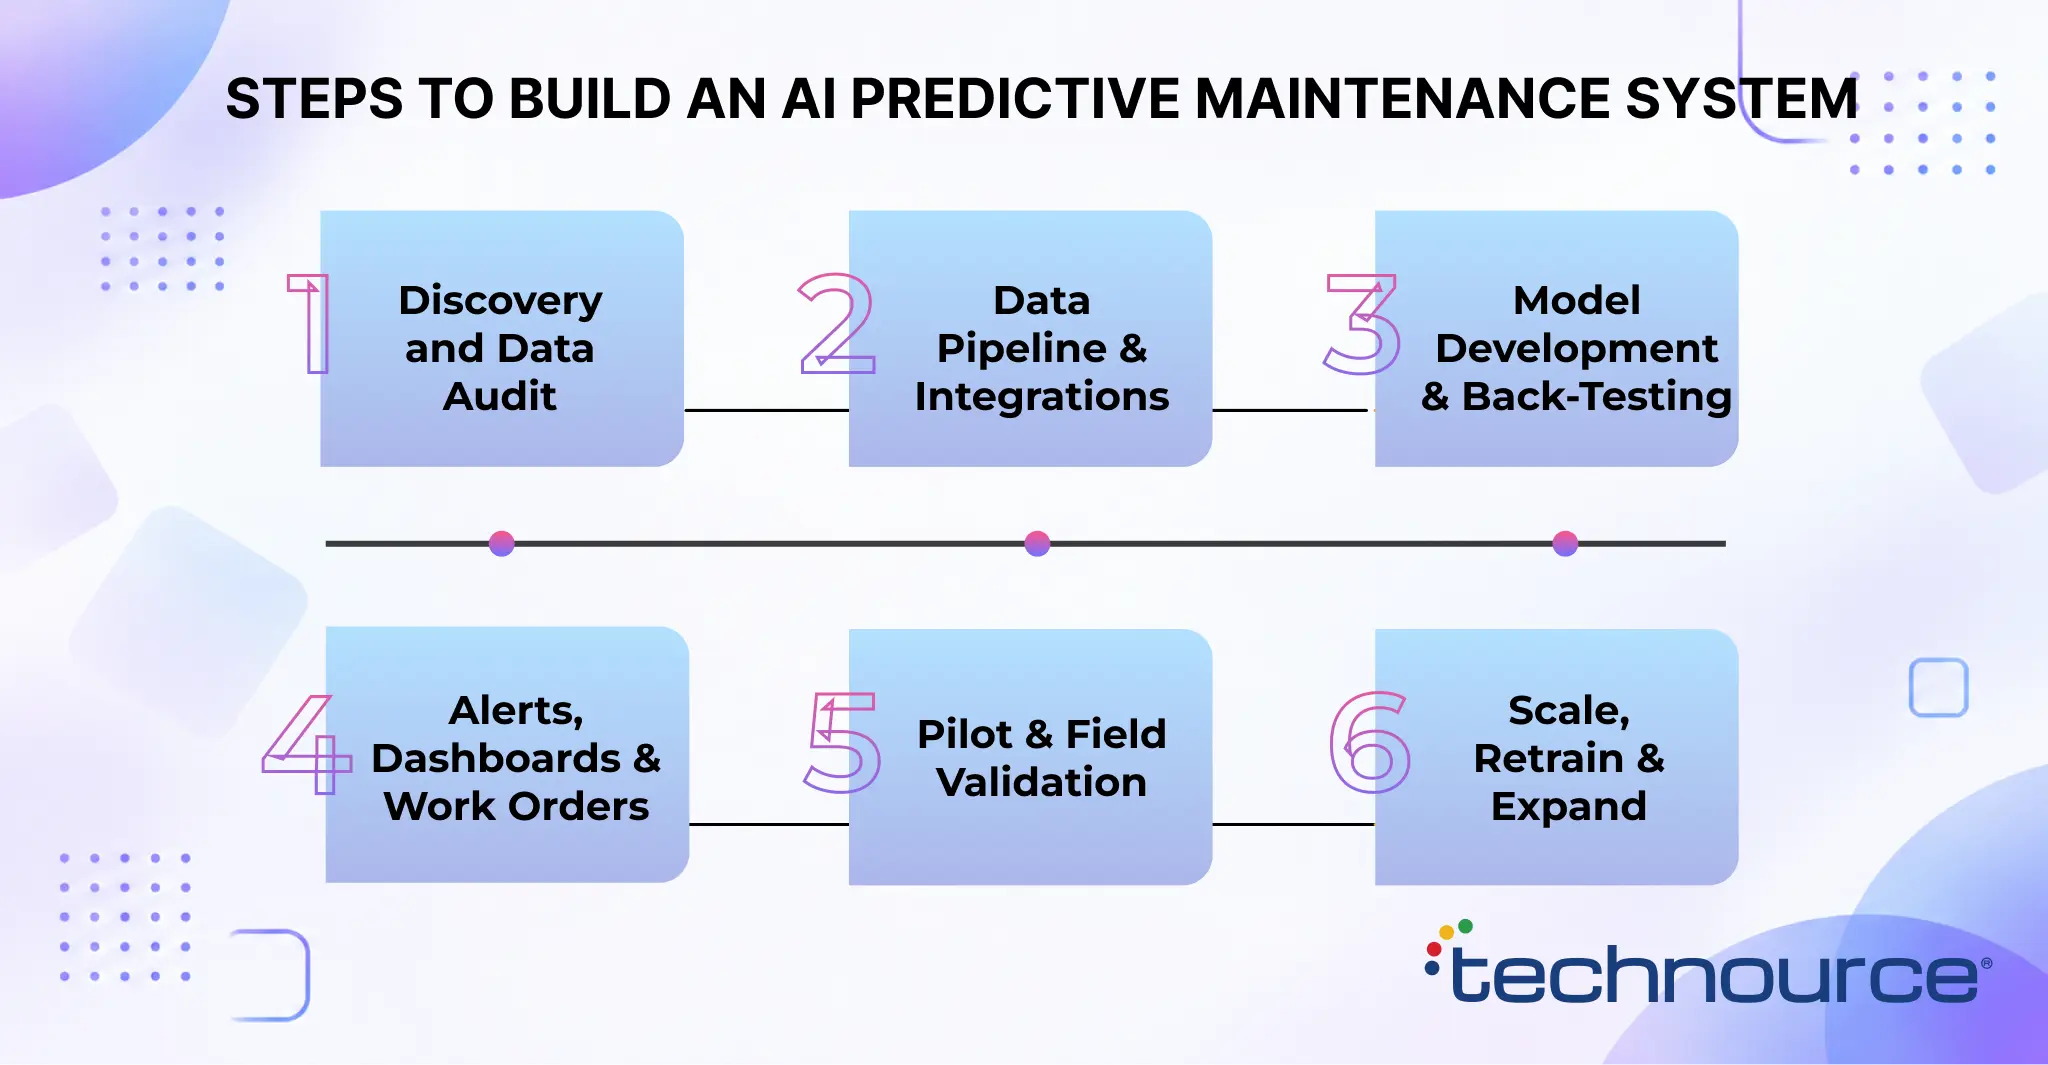
Step 1: Discovery and Data Audit (1–2 Weeks)
List the assets, failure modes, and the business metric you want to move, such as availability or truck rolls per MW.
Audit data coverage, gaps, timestamps, and tag names across every site. Then pick one asset class for the first release.
Step 2: Data Pipeline and Integrations (2–3 Weeks)
Connect SCADA, inverter, BMS, weather, and CMMS sources into one time-series store.
Align timestamps, normalize tag names, and label past failures using work-order history.
Step 3: Model Development and Back-Testing (3–4 Weeks)
Build baselines for normal behavior, then anomaly detection and failure prediction for the chosen asset class.
Back-test on past failures. Measure precision, recall, and how many days ahead each fault was caught.
The scope discipline used to build an AI MVP applies here: one asset class, one metric, one site group.
Step 4: Alerts, Dashboards and Work Orders (2–3 Weeks)
Rank alerts, add confirm-before-alert rules, and push tickets into the CMMS.
Give field crews a mobile view with the fault, location, and suggested parts.
Step 5: Pilot and Field Validation (2–4 Weeks)
Run the system on one site group alongside current processes.
Track true and false alerts, time saved, and energy recovered. Tune thresholds with the technicians who close the tickets.
Step 6: Scale, Retrain and Expand (Ongoing)
Add sites and asset classes once the pilot hits its target metric.
Retrain models as equipment ages, firmware changes, and new failure modes appear.
How Much Does AI Predictive Maintenance Cost?
AI predictive maintenance for solar and battery storage costs $5,000–$10,000 for a single-site proof of concept, $10,000–$50,000 for an AI MVP covering one fleet, and $60,000–$100,000 for a multi-site enterprise platform. Ongoing cloud, data, and support costs depend on fleet size and data volume.
| Build Type | Scope | Cost (USD) | Timeline |
|---|---|---|---|
| Proof of concept | One site, one asset class, historical data, anomaly report and back-test | $5,000–$10,000 | 4–6 weeks |
| AI MVP | One fleet, live data, anomaly detection and failure prediction, ranked alerts, dashboard, CMMS work orders | $10,000–$50,000 | 10–16 weeks |
| Enterprise MVP | Multi-site portfolio, solar and BESS models, role-based access, single sign-on, multiple integrations | $60,000–$100,000 | 4–6 months |
The same drivers shape any AI app development cost, but energy projects add one more: the number of device protocols you must support.
What Drives the Cost of AI Predictive Maintenance?
| Cost Driver | Why It Adds Cost |
|---|---|
| Number of sites and data sources | Each new protocol or vendor API adds mapping and testing |
| Data quality | Missing tags, clock drift, and gaps need cleanup before modeling |
| Asset classes covered | Inverters, trackers, and batteries each need their own models |
| Failure history | Few labeled failures means more physics rules or synthetic data |
| CMMS and ERP integrations | Two-way ticket sync takes more work than one-way alerts |
| Edge processing | On-site gateways add hardware setup and remote management |
| Security and compliance scope | NERC CIP or utility security reviews add controls and documentation |
Hidden and Ongoing Costs to Budget
- Cloud storage and compute: Costs grow with the number of tags and how often you sample them.
- Model retraining: Drift checks and retraining keep accuracy up as equipment ages.
- Connector upkeep: Inverter swaps and firmware updates can break data mappings.
- Drone flights and imagery processing: Budget these only if computer vision is in scope.
- Support and on-call: Someone must own the alert queue after launch.
These running costs depend on fleet size and data volume, so price them after the data audit.
Want a realistic number for your fleet size, data, and integrations?
What ROI Can You Expect From AI Predictive Maintenance?
ROI from AI predictive maintenance comes from recovered energy, fewer truck rolls, and longer equipment life, minus build and running costs. US solar sites can lose up to about $5,000 per MW a year to equipment underperformance (Raptor Maps, 2026), so partial recovery on a large site can repay an AI MVP quickly.
| ROI Line | How to Estimate | Example: 100 MW Site |
|---|---|---|
| Revenue at risk | MW × annual loss per MW | 100 MW × $5,000 = $500,000 a year |
| Recovered revenue | Revenue at risk × share recovered by faster fixes | 20% assumed → $100,000 a year |
| Truck rolls avoided | Visits avoided × cost per visit | Use your own O&M records |
| Battery life extended | Value of delayed augmentation or replacement | Use your state-of-health and contract data |
| Build cost | One-time project cost | AI MVP: $10,000–$50,000 |
The 20% recovery rate is an assumption for illustration, not a benchmark. Your pilot should measure the real number.
A simple formula keeps the business case honest: ROI = (recovered revenue + avoided O&M cost + deferred capex − running cost) ÷ build cost.
Build vs Buy: Should You Build Custom Predictive Maintenance Software?
Buy an off-the-shelf monitoring platform if you run standard equipment and need fleet visibility within weeks. Build custom if you need models for mixed vendors, deep CMMS and EMS integration, or a product you will sell to other asset owners.
| Factor | Custom Build | Off-the-Shelf | Hybrid |
|---|---|---|---|
| Time to first value | 10–16 weeks for an AI MVP | Weeks | Weeks for core monitoring, then custom models |
| Fit to mixed fleets | Built for your vendors and data | Depends on supported connectors | Platform for data, custom models on top |
| Data ownership | Fully yours | Vendor-hosted | Shared; check export terms |
| Cost shape | Upfront build, no per-MW license | Subscription per MW or site | Subscription plus a focused build |
| Differentiation | High; can become a product | Low | Medium |
O&M providers who want to sell monitoring to other owners usually build a multi-tenant SaaS platform instead of licensing one.
Technource’s Recommendation
Start hybrid if you are still proving value. Keep a vendor platform for basic monitoring, and build custom models and work-order automation for the asset class that loses the most revenue. Move to a full custom build when per-MW fees exceed what your own platform costs to run.
What Are the Biggest Challenges in AI Predictive Maintenance?
The biggest challenges are poor data quality, too few labeled failures, alert fatigue, legacy SCADA integration, and model drift as equipment ages. Each one can stall a project after the demo stage.
| Challenge | Real Consequence | How to Solve It |
|---|---|---|
| Messy data | Gaps, clock drift, and renamed tags break models | Run a data audit and fix tags before modeling |
| Rare failures | Models have few examples to learn from | Combine anomaly detection, physics rules and labels from work orders |
| Alert fatigue | Crews ignore the system within weeks | Confirm-before-alert rules and ranking by revenue at risk |
| Legacy SCADA | Data is locked in vendor systems or site historians | Edge gateways and read-only connectors |
| Model drift | Accuracy drops after firmware updates or aging | Monitor drift and retrain on a schedule |
| Cybersecurity | New remote paths into operational systems | Read-only data flows, network segmentation and access logs |
| Adoption | Technicians keep old habits | Design the mobile view with crews and show early wins |
Few of these problems are unique to energy. They mirror the reasons why AI projects fail in most industries.
Common Mistakes to Avoid in AI Predictive Maintenance
The most common mistakes are modeling before auditing data, launching alerts without a work-order path, and trying to cover every asset class at once.
- Buying sensors first: Most fleets already have the data. Audit it before adding hardware.
- Dashboards without action: An alert that never becomes a ticket changes nothing.
- Covering every asset at once: Start with the asset class that loses the most revenue.
- Ignoring technicians: Crews know which alarms are noise. Use that knowledge to label data.
- Skipping warranty limits: Battery models that ignore warranty terms can recommend operation that voids coverage.
- No baseline: Without a before-and-after metric, you cannot prove ROI.
Which KPIs Should You Track After Launch?
Track availability, energy recovered, mean time to repair, truck rolls per MW, alert precision, and battery state of health. Together, these KPIs show whether the system finds real faults and whether crews act on them.
| KPI | What It Shows | How to Measure |
|---|---|---|
| Availability | Share of time assets can produce | SCADA uptime against total hours |
| Energy recovered | Output saved by earlier fixes | Expected vs actual output before and after repair |
| Mean time to repair (MTTR) | Speed from fault to fix | Alert time to work-order close time |
| Truck rolls per MW | Field efficiency | CMMS visits ÷ MW under management |
| Alert precision | Share of alerts that were real faults | Confirmed faults ÷ total alerts |
| Detection lead time | How early faults are caught | Days between first alert and failure or repair |
| Battery state of health | Pace of degradation | Capacity tests and BMS state-of-health trends |
| Warranty recoveries | Value of logged evidence | Claims approved and value recovered |
How to Choose an AI Predictive Maintenance Development Company
Choose a partner that has shipped IoT data pipelines and production machine learning, can integrate with your SCADA and CMMS, and will scope a paid proof of concept before a full build. Ask to see live monitoring products, not only demos.
| Question to Ask | Good Answer | Red Flag |
|---|---|---|
| Which protocols have you integrated? | Names Modbus, OPC UA, MQTT, and vendor APIs they have shipped | “We will figure it out” |
| How do you handle rare failures? | Anomaly detection, physics rules and work-order labels | Promises high accuracy before seeing data |
| How do you prevent alert fatigue? | Confirm-before-alert rules, ranking and crew feedback | Sends every anomaly as an alert |
| Who owns the code, models, and data? | You do, in your own cloud account | Vendor-hosted models with no export |
| What will the proof of concept prove? | One asset class, one metric, a back-test on past failures | Vague insights with no success metric |
| What happens after launch? | Drift monitoring and a retraining plan | No support plan |
Technource brings 14+ years of product engineering experience to its cleantech software development services and is rated 4.9/5 on Clutch and 4.9/5 on GoodFirms.
What Are the Future Trends in AI Predictive Maintenance?
The main trends are robots and drones feeding models with frequent inspection data, physics-informed battery models, AI-powered workflow automation that closes work orders, and maintenance timed to energy prices. Together they move O&M from finding faults to fixing them at the cheapest moment.
Robots and Drones Replace Annual Inspections
Frequent robotic and drone inspections give models fresh labels every week instead of once a year. That is one reason automated sites lose less power.
Physics-Informed Battery Models
Hybrid models combine electrochemistry with machine learning. They predict degradation with far less failure data than pure machine learning needs.
Workflow Automation That Closes the Loop
AI-powered workflow automation will draft work orders, reserve parts, and book crews. A supervisor approves each step.
Maintenance Timed to Market Prices
Battery maintenance windows will be scheduled for low-price hours, so downtime costs less revenue.
Digital Twins for Hybrid Plants
Plant-level digital twins will test setpoint and maintenance changes before crews touch real equipment.
How Technource Delivers Measurable Results in Monitoring and Automation Platforms
Technource has shipped platforms that turn device data into alerts, decisions, and field actions. These two projects use the same building blocks a solar and storage predictive maintenance system needs.
How Technource Built Digital Biologix, a Smart Greenhouse IoT Platform With 65% Faster Environmental Adjustments
We built Digital Biologix, a B2B smart automation platform for a US client that lets greenhouse operators monitor and control lighting, temperature, humidity, and CO₂ remotely.
Operators managed many environmental controllers by hand, and setting changes lagged on weak networks.
Technource connected the controllers to Flutter mobile apps through MQTT and AWS IoT Core for real-time, two-way data. We added device grouping and configuration cloning, tuned message queues and payloads, and secured every channel with encrypted MQTT, JWT, and SSL.
The stack included Flutter, Laravel, MySQL, MQTT, and AWS.
Remote solar and storage sites need the same pattern: reliable device data over weak links and fast remote action.
Measurable Result
- 65% faster response time for environmental adjustments
- 100% real-time data visibility through IoT connectivity
- Near-instant device sync, even on low-bandwidth networks
- Configuration cloning across devices, cutting repetitive setup and human error
- Encrypted channels and automated backups for uninterrupted data availability
How Technource Built Clean Medic, a Smart Waste Management Platform With 65% Faster Waste Collection
We built Clean Medic, a digital platform that modernizes medical waste management in Indonesia, from pickup to incineration.
Tracking ran on paper forms, pickups were poorly coordinated, and producers struggled to prove safe disposal.
Technource built role-based apps for producers, drivers, warehouses, and factories, with QR-coded containers and Bluetooth-enabled scales that log every movement. A tour scheduling algorithm groups nearby pickups to fill truck capacity, and the platform issues digital incineration certificates automatically.
The stack included Laravel, React.js, MySQL, Flutter, BLE IoT, Firebase and Google Maps.
Grouping field jobs by location and urgency is the same logic that cuts truck rolls in solar and storage O&M.
Measurable Result
- 65% faster waste collection
- 50% lower operational errors
- Full chain-of-custody tracking from pickup to incineration
- Automatic digital incineration certificates as compliance proof
- One connected system for producers, transporters, warehouses, and factories
Technource’s Approach to AI Predictive Maintenance
- Data audit first: We map every tag, gap, and timestamp before a model is trained.
- One asset class, one metric: The first release targets the asset that loses the most revenue, with a clear KPI.
- Confirm before alert: Every alert passes a rule or second check before a technician sees it.
- Alerts become work orders: The system writes to your CMMS, not just a dashboard.
- You own everything: Code, models, and data stay in your cloud account.
Conclusion
AI predictive maintenance for solar and battery storage pays off when three decisions are right.
Start with the data you already have. Pick the asset class that loses the most revenue. Send every confirmed alert straight into a work order.
Get those right, and a 10–16 week AI MVP can show recovered output before you scale across the fleet.
Technource is an AI development company and a CleanTech software development partner that builds monitoring, machine learning, and workflow automation as one product.
If you are ready to scope your first site or fleet, contact us for a short call that maps your data, budget, and timeline.
Ready to turn your O&M data into fewer truck rolls and less downtime?
FAQs
AI predictive maintenance for solar and battery storage uses machine learning on SCADA, inverter, tracker, and battery data to flag faults before they cause downtime, then turns each risk into a work order. The need is growing fast, with roughly 43 GW of new utility-scale solar and 24 GW of battery storage planned for the US in 2026 (EIA, 2026 Budget $5,000–$10,000 for a single-site proof of concept. An AI MVP covering one fleet, with anomaly detection, ranked alerts, and CMMS work orders, costs $10,000–$50,000. A multi-site enterprise platform costs $60,000–$100,000. Ongoing cloud, data, and support costs depend on fleet size, data frequency, and the number of integrations. Our AI MVP development cost guide breaks these tiers down. Plan 4–6 weeks for a proof of concept. An AI MVP takes 10–16 weeks, covering a data audit, pipelines, models, alerts, and a field pilot. A multi-site enterprise rollout takes 4–6 months, mainly because each new site adds data sources and vendor integrations to test. ROI depends on how much lost output you recover and how many truck rolls you avoid. Equipment issues cost the average US solar site about 5% of its power in 2025, against about 3% at sites using robotics and automation (Raptor Maps, 2026). A pilot should measure your own recovery rate before you scale. Yes. Models track cell voltage drift, temperature outliers, internal resistance, and state-of-health trends to flag weak modules and cooling problems early. Serious incidents are now rare: BESS failures per deployed GWh dropped 98% from 2018 to 2025, but older systems remain more failure-prone (EPRI, 2026). Start with at least 12 months of SCADA or inverter data at 5- to 15-minute intervals, battery management system data for storage assets, weather data and CMMS work-order history. Most fleets already collect this data, so a 4–6 week proof of concept can usually begin without new sensors. Predictive maintenance is better for high-value assets such as inverters, trackers, and battery racks, while preventive schedules still suit cleaning, vegetation, and compliance checks. The shift matters because crews are stretched: technicians now look after 70% more MW each than they did five years ago (Raptor Maps, 2026). Buy a platform if your equipment is standard and you need fleet visibility within weeks. Build custom if you run mixed vendors, need deep CMMS and EMS integration, or plan to sell monitoring to other owners. Many teams start hybrid, adding a $10,000–$50,000 AI MVP for their highest-loss asset class. Battery storage sites commonly work under NFPA 855 for installation, UL 9540 and UL 9540A for system safety and thermal runaway testing, and NERC CIP where assets fall in scope. Monitoring software supports these with logs, alarms, and access controls, but it does not certify a site. Confirm your obligations locally. Yes. About 73% of insured solar losses by damage amount come from hail (kWh Analytics, 2026). Predictive systems combine storm forecasts with tracker data to trigger hail stow early, confirm which rows moved, and flag damaged modules for inspection after the storm.
Related Insights and Articles