Debugging is a crucial skill in the world of Noe.js development. It ensures smooth and error-free applications. As developers come to know the complexities of coding, encountering bugs is inevitable. Developers debug NodeJs applications for their proper functioning and high performance.
You will know the significance of effective Node JS debugging and offer practical insights into the best tips and techniques from the top Node JS development company in this blog.
Whether you are a seasoned developer or just starting with Node.js, mastering debugging will enhance your ability to create reliable and efficient applications. So, join us on a journey to streamline the NodeJS development process and produce high-quality code.
What is Node JS debugging?
Debugging stands as a cornerstone in software development and plays a pivotal role in identifying and resolving issues within code. It involves the systematic process of detecting, isolating, and fixing errors to ensure the application’s smooth functionality. Effective debugging not only enhances the reliability of code but also contributes to the overall efficiency of the development cycle.
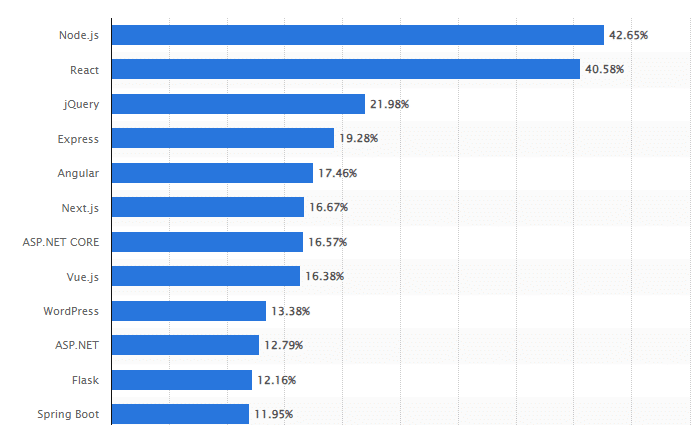
As you can notice in the below image the most used web framework among developers in the world. Node JS is at the top, it is used by 42.65% of developers.
Node JS revolutionized JavaScript by extending its capabilities beyond the browser to server-side development. As a powerful runtime environment, Node JS empowers developers to execute JavaScript code server-side. It opens up new possibilities for scalable and feature-rich applications. Understanding Nodejs is important to mastering debugging within this dynamic and versatile environment it helps to debug NodeJs applications.
Common Node js debugging challenges
Debugging many times comes with specific challenges for developers. Issues may range from asynchronous code complexities to memory leaks, unhandled exceptions, or performance bottlenecks. Recognizing these challenges is crucial for effective debugging, it ensures a proactive approach to resolving issues.
Asynchronous code complexities:Asynchronous code complexities in Node JS refer to challenges in managing operations that don’t follow the traditional asynchronous flow. Identifying and resolving these issues involves understanding the intricacies of asynchronous programming such as handling callbacks, promises, and managing the event loop.
When you Hire node JS developers must ensure that they can use asynchronous operations to execute correctly, avoid callback hell, and manage error handling effectively. Debugging asynchronous code involves tracing the flow of execution, checking for callback errors, and ensuring proper sequencing of events to maintain the application’s stability and responsiveness.
Memory leaks:Memory leaks in Node js debugging involve identifying and addressing issues where the application fails to release allocated memory. It leads to resource exhaustion. Detecting memory leaks requires tools like heap profilers and monitoring memory usage over time.
Developers need to analyze code, check for crucial references, and release unused objects to optimize memory usage. Debugging memory leaks is crucial for maintaining application performance and preventing crashes due to excessive memory consumption. It ensures stable and efficient Node.JS application.
Unhandled exceptions:In Node js debugging unhandled exceptions refer to unexpected errors or issues that occur during run time but are not adequately addressed by the code. Handling these exceptions is crucial to prevent application crashes. Developers use try-catch blocks, event listeners, and error-handling middleware.
It helps to identify and manage unhandled exceptions effectively. It ensures that the application gracefully handles errors, providing a more robust and reliable user experience. Debugging unhandled exceptions is essential for enhancing the overall stability and resilience of a Node JS application.
Performance bottleneck:Performance bottlenecks in Node.js debugging involve identifying areas in the code that lead to slowdowns and optimizing them for improved performance. Developers often use profiling tools and performance monitoring to analyze the execution of the application. By pinpointing bottlenecks, such as inefficient algorithms or resource-intensive operations.
Developers can make targeted improvements to enhance the overall speed and efficiency of the Node.js application. They can compare Node JS vs Golang as well. Addressing performance bottlenecks ensures a smoother and more responsive user experience. It makes it a critical aspect of effective Node.js debugging.
What are the essential tools for Node JS debugging
Node js developers have a variety of debugging tools at their disposal to enhance the development and troubleshooting process. These tools offer unique features and capabilities to debug NodeJs applications.
Features and benefits of each tool:
Node Inspector: Features: Real-time code execution monitoring, interactive debugging, and profiling. Benifits: User-friendly interface, easy integration with Chrome dev tools.
Visual Studio Code Features: Integrated debugging tools, breakpoints, and powerful code editor. Benifits: Seamless integration, extensive community support, and cross-platform compatibility.
Chrome Devtools Features: Browser-based debugging, profiling, and performance analysis Benifits: Direct integration with Google Chrome and real-time inspection of client-side JavaScript.
NDB Nodedebugger Features: Improved debugging experience, asynchronous stack traces, and native support for the ECMAScript module. Benifits: Simplified debugging process and enhanced support for modern JavaScript features.
Choosing the right tool depends on the development project’s specific needs, and each tool brings its unique advantages to the table. You should check out the positive and negative aspects of Node JS and understand which features can work effectively and which features are suitable for your project.
Best tips and techniques to follow for Node JS debugging
With the help of the best tips and techniques, you can perform effective and quick Node JS debugging.
Setting breakpoints and inspecting variables
Strategic Placement: Place breakpoints strategically in your code to begin execution at key points. It allows you to inspect variables, assess their values, and understand the flow of your program.
Variable inspection: Utilize the debugger to inspect variable values at runtime. It helps identify discrepancies and understand how data evolves during execution.
Leveraging console.log effectively
Diagnostic output: Use the ‘console.log’ statements strategically to output diagnostic information. This is a quick and straightforward way to trace the flow of your program and identify potential issues.
Conditional logging: Employ conditional ‘Concole.log’ statements to output information only when certain conditions are met. It minimizes unnecessary output and focuses on relevant data.
Utilizing debugging statements and assertions
Debugging statements: Insert intentional errors or debugging statements in your code to trigger breakpoints. This approach helps in isolating problematic areas and understanding code execution.
Assertions: Integrate assertions to validate assumptions about your code. If an assertion fails, it indicates a discrepancy that helps you catch errors early in the development process.
By combining these tips and techniques, developers can streamline their Node JS debugging process, identify issues efficiently, and enhance the overall reliability of their applications.
By focusing on the below points you can effectively handle asynchronous code to debug NodeJs applications.
Challenges with debugging asynchronous operations-
Callback Hell: Asynchronous code often involves nested callbacks, leading to the notorious ‘callback hell’. Debugging becomes complex due to the intricate callback structures.
Timing Issues: Identifying the timing of asynchronous events can be challenging. This is especially true when multiple operations occur concurrently. This can result in unexpected behavior.
Techniques for effective debugging in asynchronous scenarios-
Async/Await: Embrace the ‘async/await’ syntax for handling asynchronous operations. It simplifies the code structure, making it more readable and aiding debugging.
Promise chains inspection: Utilize debugging tools to inspect promise chains. It allows you to trace the flow of asynchronous operations and identify issues within the chain.
Error handling: Implementing robust error-handling mechanisms for asynchronous functions ensures that errors are caught and properly logged, aiding in debugging efforts.By addressing these challenges and employing effective debugging techniques, developers can navigate the complexities of asynchronous code in Node.js. It leads to more reliable and maintainable applications. Now you must have understood why to use Node JS for the next project as it enhances the performance and makes error handling smoother.
Understand the memory leak detection and resolution
A memory leak occurs when a program unintentionally retains memory that should be released. It leads to gradual resource exhaustion. Continuous memory leaks can degrade application performance. It eventually causes crashes and slowdowns.
Tips for detecting and resolving memory-related issues:
Use memory profiling tools:
Leverage built-in tools or external packages for memory profiling. Analyze memory snapshots to identify objects and functions causing memory retention.
Monitor heap usage:
Be vigilant on heap usage over time. Sudden spikes and continuous growth may indicate a potential memory leak.
Frequent garbage collection:
Optimize garbage collection settings to run more frequently. It helps in reclaiming unused memory and mitigating memory leaks.
By understanding the nuances of memory leaks and implementing proactive detection and resolution strategies, developers can ensure the stability and reliability of their Node.js applications.
How to improve the performance of your application?
You can improve application performance by using debugging insights as follows.
Identify bottlenecks:
Profiling and debugging tools offer insight into areas causing performance bottlenecks. They pinpoint sections of code that consume excessive resources. It helps to debug NodeJs applications effectively.
Optimize algorithms:
Debugging reveals inefficient algorithms. Refactor code to use optimized algorithms, enhancing overall application speed.
Monitor event loop:
Analyze the event loop to ensure it runs efficiently. Mitigate delays by optimizing asynchronous operations within the loop.
Here are some tips for optimizing code during the debugging process.
Incremental testing: Optimize code in increments, testing changes to check performance improvement.
Use caching strategically: Employ caching mechanisms for frequently accessed data, reducing redundant computations.
Concurrency control: Manage concurrency effectively and ensure a balance between parallel execution and resource utilization.
By interviewing debugging practices with performance optimization strategies, developers can cultivate high-performing and responsive Node.js applications.
Conclusion:
Let’s conclude this blog here. We delved into the difficulties of Node.JS debugging, addressing common challenges, exploring essential tools, and uncovering best practices. From handling asynchronous code complexities to detecting memory leaks and optimizing performance. Remember that effective debugging is not just a troubleshooting tool but a skill that increases the quality and efficiency of your code. Embrace these tips and techniques, cultivate a debugging mindset, and watch how they transform your development experience.